Engineering: Generating synthetic traffic to monitor system health
Every software engineer has grappled with the same age-old question when shipping code: how can we be confident that the app is actually working?
A reasonable default answer would be to write more tests. Nothing gets merged or deployed unless CI is green. Then, set up monitoring on top of all production systems and write alerts based on the metrics you collect.
However, the real world is complex. While engineers should follow the best practices around testing and monitoring, they need to be aware of the limitations. Tests and alerts can only reveal the presence of something wrong; they cannot prove the absence of errors.
Consider certain limitations around traditional testing and monitoring. While not impossible to account for, they are harder to address:
- Tests may not catch configuration errors. For example, certain users might not have proper permissions.
- Tests may not run on realistic data. For example, a large dataset may make queries run slower than expected.
- Metrics may not cover specific use cases. For example, a certain button may render but no longer be clickable.
- Production state may change. For example, version skew between services can cause an incompatibility between API calls. Only a small percentage of requests might fail, but it may render the app unusable for a given user.
- The engineering team may not have enough bandwidth to achieve perfect test and metric coverage. Time is a limited resource, and there may be higher leverage problems to tackle.
Ensuring correctness is a high-stakes issue, especially for cybersecurity companies like Stairwell. It’s bad if a user encounters an error or if a demo runs into a hiccup. But it’s unacceptable if we lose data integrity or user trust. Therefore, if anything seems to be off, we need the means to know as soon as possible.
Accounting for those nuances, the age-old question around correctness expands into a few sub-questions:
- How do we get direct confidence that the app is working as intended in production?
- How can we catch issues that tend to slip past traditional testing and monitoring?
- How will we know when something goes wrong?
- How can we solve all of the above in a high-leverage way with relatively minimal work?
This post attempts to answer how Stairwell addressed these questions.
Designing a prober
If you want direct confidence that something’s working, you measure it directly. Hence we opted to create a service that repeatedly probes the app in production. It lives on different infrastructure and periodically emulates user behavior on the app. The app itself cannot distinguish that it was receiving synthetic traffic. If the prober service were unable to go through its “user flow” for some reason, it would be indicative of an issue.
In order to design a framework that can effectively probe production apps, we break down the design into a relatively simple approach:
- Allow some means to do browser automation on our app.
- Expose a library so that other developers can do the same.
- Make the framework play nice with monitoring systems (i.e. Prometheus) and debugging errors.
Browser automation with chromedp
There already exist quite a few browser automation libraries. We ended up building on top of chromedp due to language compatibility (Stairwell is mainly a Go shop). For readers less familiar with browser automation, most libraries expose the ability to interact with the DOM (e.g. “click this button”) and make assertions about the DOM (e.g. “throw an error if this element is missing”).
Beyond simply using chromedp as a library, there are additional nuances to keep in mind:
- Browser automation requires having an actual browser as a dependency. So, a prober may need a different Docker image than what a traditional server might run on.
- Realistic traffic goes through authentication. Hence, there’s also a need to set up service accounts that otherwise appear to be legitimate accounts.
- Programmatic traffic (i.e. API calls) are important to synthesize, too. However, that’s less interesting of a topic, so we won’t discuss it in detail here.
- A nice thing about browser automation is the ability to take screenshots. That becomes invaluable for debugging.
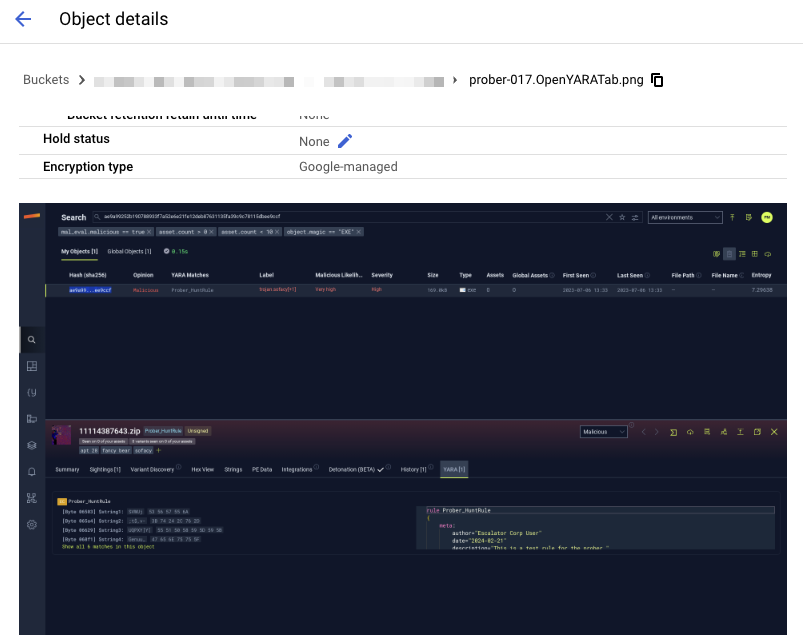
While the prober crawls through the app, it periodically uploads screenshots to Google Cloud Storage. Later if there are any issues, engineers can view all the relevant screenshots for debugging purposes.
Exposing a library
In front of the sausage-making, all we care about is that a synthetic user takes a series of well-defined actions on the app. Beyond that, we may want multiple independent synthetic user flows. So we have two public interfaces, shown below (there may be multiple implementations of these interfaces, but the interfaces themselves are simple).
package workflow

// Task represents an action a user could take while on the Stairwell platform.
type Task interface {
	Name() string
	Run(context.Context) error
}

// Workflow contains a series of Tasks that emulates an end-to-end user session.
type Workflow interface {
	Load(...Task)
	Run(context.Context) error
}
A Workflow is the top-level entity that contains an end-to-end user flow. When run, it executes a set of tasks in series from scratch. For example, a demo would roughly correspond to a Workflow. Different workflows (and multiple runs of the same workflow) are all independent of each other.
A Task represents a semantic action that a user might take. Think of things like navigating to a certain page, clicking a certain set of buttons, or logging in. These are meant to be reusable. Under the hood, a task may involve multiple chromedp actions and the usage of DOM selectors.
Take for example the implementation of a task that opens a tab with YARA scan results. At the lowest level, it’s a matter of figuring out which DOM selectors are necessary to open up a tab and packaging it into a struct that implements the interface.
package browser

func (b *Browser) OpenYARATab(opts ...Option) workflow.Task {
	return b.generateTask(
		"OpenYARATab",
		[]chromedp.Action {
			chromedp.Click(`button[name~="YARA"]`),
			chromedp.WaitVisible(`.yara-table`),
		},
		opts...,
	)
}
Browser-based task implementations will take the chromedp actions and then execute them. It will then take a screenshot of the current browser. The implementation behind the workflow interface will manage the context, report metrics, and run all of the tasks in series. The library details all get abstracted away.
As a result, new developers can write a new workflow in only a few lines of code!
b := browser.New()
rc := apis.NewRESTClient()

var hash string
wf := workflow.NewWorkflow(
	workflow.WithMetricLabel("my_metric_label"),
	workflow.WithTimeout(3*time.Minute),
)
wf.Load(
	b.Login(username, password),
	b.NavigateToDashboard(browser.WithTimeout(10*time.Second)),
	b.NavigateToSearchPage(),
	b.RunSearch("I want peanuts", &hash),
	rc.CheckMetadata(&hash),
)
err := wf.Run(ctx)
Putting it all together
The nice part about having a library layer is that the workflow itself can be run under various use cases. Engineers can run it locally via the command line for debugging purposes. Servers can run it for monitoring. We will focus on the latter.
To productionize the prober, we deploy a server that periodically runs all unique workflows. Each workflow reports a Prometheus histogram metric, labeled by the workflow’s name and its error status. Since there’s a metric directly corresponding to whether a user flow in the app is working or not, we can form relatively high-level alerts around those metrics.
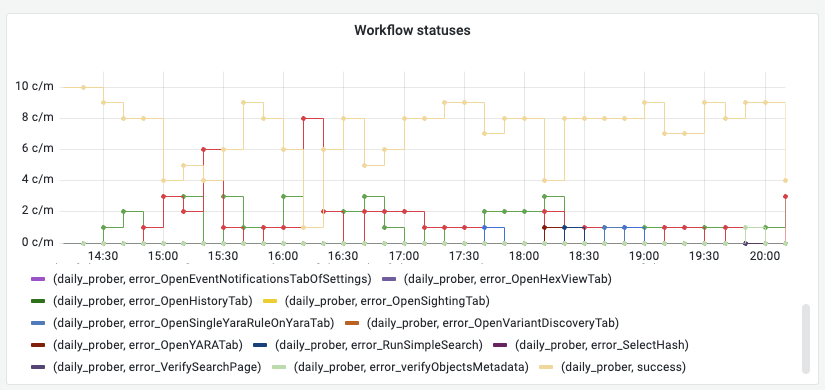
A dashboard with any prober-encountered errors. It gives a quantifiable metric of issues users might be directly seeing.
Practical considerations
Improving our processes
A good engineering practice is to leave the forest better than you found it. Fortunately, creation of the prober has created opportunities beyond just monitoring improvements.
- The first workflows were written to emulate demos of the app. Hence it was immediately helpful to the Go-to-Market team.
- When building new features, engineers are now encouraged to write a new prober workflow.
- Any issues caught by the prober (that weren’t caught by other systems) now warrant a new test or alert to be written.
Trade-offs and FAQ
Why can’t this be an e2e test?
It can! Prober workflows can be run both during CI and continuously against production.
What happens if a workflow corrupts production data?
For now, workflows only do read-only operations. It makes sense to have the prober create and delete data, but that’s for a future iteration. From a secure standpoint, workflows are run with service accounts with rather limited permissions.
Can the prober be replaced with better tests/metrics/alerts?
Not quite. A prober is just another unique form of gathering confidence. It’s not mutually exclusive with other methods of measuring reliability. In some sense, you can think of it as the “e2e test” of a metric. It exhibits end-to-end coverage, but there’s no other way to measure it against a live production environment.
Does synthesizing production traffic interfere with other production metrics?
Yes, it does. This is an accepted trade-off because it creates a predictable level of well-defined traffic. Therefore, it’s simple enough to infer and work around prober traffic.